
How Long is a Curl?
The problem is easy to describe — we wanted to understand why a simple web request (using HTTPS) initiated from our Vancouver office was…


The problem is easy to describe — we wanted to understand why a simple web request (using HTTPS) initiated from our Vancouver office was taking anywhere from 500 ms to 1 second to be processed by our AWS-based application hosted in Amazon’s Virginia data centre.
The confusion arose because our application’s log files told us the request took 8 ms to complete, and we know the round-trip network latency from Vancouver and Virginia (which is 4000km away) should be roughly 80 ms.
How does 80 ms + 8 ms suddenly turn into 500 ms to 1000 ms?
To do our testing, we used the Unix curl command, which makes an HTTPS request to a remote web server:
$ time curl https://app.acl.com
real 1.094s
user 0.030s
sys  0.009s
$ time curl https://app.acl.com
real 0.490s
user 0.023s
sys 0.006s$ time curl https://app.acl.com
real 0.503s
user 0.029s
sys 0.008sIn each of these three cases, we’re only interested in the “real” time, which is how many seconds it took to execute the curl command. The first time we ran the command, it took 1094 ms, the second time it was 490 ms, and the third time it was 503 ms.
Let’s figure out why this is happening, and why it’s so much higher than the expected 88 ms.
Step 1 — Always Ignore the First Attempt
As a general rule you should throw away your first measurement. In our case, 1094 ms is double the other two measurements (490 ms and 503 ms), which makes it look highly inaccurate. In fact, when we re-run the curl command multiple times, each successive measurement is roughly 500 ms, so our first measurement was probably an outlier.
In reality, the first invocation of curl performs additional work that the successive calls don’t. For example, the executable program images for both the time command, and the curl command, need to be loaded off our computer’s disk, and brought into memory. This takes a while the first time it happens, but after it’s already in the memory-based disk cache it’ll be much faster to load.
Second, our local computer needs to resolve the app.acl.com DNS name to find the underlying IP address, which in our case is 52.7.250.34. On successive invocations of the curl command, this IP is already known so there’s no need to do the DNS lookup again
Now that we’ve understood why it’s important to ignore the first measurement, we’re still left with no explanation of why the remaining measurements are roughly 500 ms. This is still far more than the 88 ms we’re expecting.
Step 2 — Are We Correct About the Network Latency?
To double check our assumptions on network latency are valid, we checked with third-party sources. There are numerous tools that can tell you the latency from your own computer to Amazon’s data centres, including http://www.cloudping.info/, which shows the following:

Naturally, you’ll get different numbers if you run this from your own computer, located somewhere else on the Internet. In our case we confirm that Virginia is roughly 80 ms away from our office (86 ms in this particular test run).
Step 3— Maybe It’s Just Our Servers?
It was good to confirm the expected network latency is around 80 ms, but we then wondered if there’s something peculiar about our own network configuration. What if our application servers, or the load balancer that sits in front of them were configured badly?
To validate this concern, we used the ping tool to verify the latency to our own servers. Unfortunately, this wasn’t possible the first time we tried, since our servers had the ICMP protocol (which ping relies on) disabled by default.
To enable ping, we modified the AWS security group settings for our Elastic Load Balancers. We added support for the ICMP protocol, at least for the duration of the tests:

Upon using ping to directly communicate with our load balancer, we again confirmed that the latency is roughly 80 ms.
$ ping app.acl.com
PING app.acl.com (52.7.250.34): 56 data bytes
64 bytes from 52.7.250.34: icmp_seq=0 ttl=48 time=81.104 ms
64 bytes from 52.7.250.34: icmp_seq=1 ttl=48 time=81.154 ms
...
A similar test of directly pinging the application servers provided the same result.
Step 4— Maybe the Logs Are Wrong?
At this point, we wondered whether the application server log files were incorrect. They were reporting the request was only taking 7–8 ms to execute, but what if there was something odd happening inside the Linux-based application server, before the request reached our application?
This is unlikely to be the problem, but let’s confirm using the tcpdump tool on the application server itself. This is a low-level tool allowing us to observe network packets arriving and leaving via the Linux server’s network interface. We can therefore observe raw TCP/IP packets traversing the system before they’re passed onto the application.
The user interface for tcpdump is not the most intuitive, so we captured the network packets to a file, then viewed the data using the wireshark tool, which has a very nice UI.
Here what we used to capture the packets on the application server (running in Virginia):
# sudo -s
# tcpdump -w packets
tcpdump: listening on eth0, link-type EN10MB (Ethernet), capture size 65535 bytes
The packets file was then loaded into the Wireshark tool (running on a local desktop machine in Vancouver). Here’s the specific packet trace relating to our HTTP request
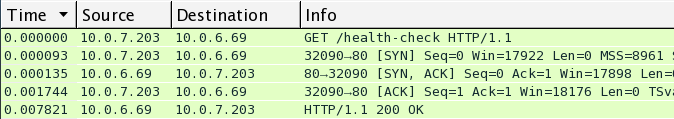
There’s a lot of detail in the output from Wireshark, but the most important observation is the GET request arriving at time 0.000000, and the corresponding response at 0.007821, which is 7 ms later.
So, we’ve confirmed that our original measurement of 8ms is still roughly correct.
Step 5— What About HTTP Instead of HTTPS?
So far we’ve used a third-party tool to confirm our network latency is roughly 80 ms, and have also used ping to confirm that number.
But, ping uses the ICMP “echo” protocol, which is much lighter-weight than HTTP, and certainly much lighter-weight than HTTPS, which adds encryption.
Here’s a thought… our initial measurements were using HTTPS, but what if we tried using plain un-encrypted HTTP protocol? We repeated our original tests, but this time using http://.
$ time curl http://app.acl.com
real 0.665s                        # NOTE: discard due to caching.
user 0.010s
sys  0.006s
$ time curl http://app.acl.com
real 0.177s
user 0.004s
sys 0.003s$ time curl http://app.acl.com
real 0.177s
user 0.004s
sys 0.003sWow… 177 ms is much faster than our original 500 ms for HTTPS. On the surface it appears that the SSL-based HTTPS system is taking an additional 300+ ms to encrypt a very small GET request and response. How can that be?
Let’s do another test, but this time between Vancouver and a similar application running in Amazon’s Oregon data centre (which should have roughly 20 ms of network latency from our office). In this case, we’re mostly interested in the time difference between the HTTP and HTTPS cases:
$ time curl https://app-2.acl.com   # NOTE: HTTPS case
real 0.151s
user 0.026s
sys  0.007s
$ time curl http://app-2.acl.com # NOTE: HTTP case
real 0.039s
user 0.004s
sys 0.004sIn this case, we’re seeing 151 ms for the HTTPS request (compared to 39 ms for the HTTP request). This measurement for HTTPS is still much higher than the 20 ms (latency) + 8 ms (application time) we’re hoping for.
However, the difference between HTTPS and HTTP is now 110 ms, rather than the 300 ms we saw in the previous tests. Could there be some interaction between the HTTPS/SSL protocol, and the fact that Virginia is significantly further away than Oregon?
Step 6— Look at Detailed Packet Traces
Here’s a theory — what if the overall HTTPS request time is dependent on the network latency between our local computer and the distant AWS servers? Let’s use our network packet sniffer again.
Rather than show the raw output from tcpdump or wireshark, we’ll summarize the packet capture using easy-to-read sequence diagrams.
With Ping
The ping (“echo”) protocol consists of two messages: a request from the client, directed towards the server, and then a response in the opposite direction. Drawing our packet capture as a sequence diagram, we see the following:
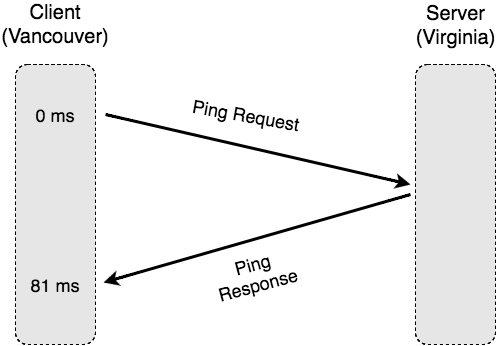
Our packet capture again confirms that our estimated round-trip time is roughly 80 ms. In reality though, web connections don’t use ping because they need to reliably and securely send data, not just a short meaningless ping message.
With unencrypted HTTP
Given that the HTTP protocol sits on top of the standard TCP/IP protocol. the interaction is a little more complicated. Before any data can be transmitted, TCP’s three-way handshake is used to ensure that both the client and server agree to the connection.
Here’s a similar sequence diagram, showing the communication we saw in our packet capture:
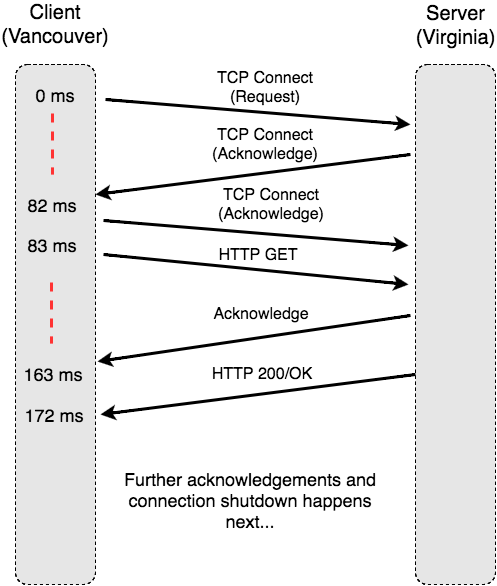
The important observation here is that the standard TCP connection mechanism requires a full round-trip time (from 0 to 82 ms) for the TCP connection to be established. After that (from 83–172 ms) the actual HTTP request is sent, acknowledged, and then responded to.
By simply using HTTP, instead of basic ping, the time for the request has doubled! Let’s now look at the equivalent sequence diagram for HTTPS.
With encrypted HTTPS
With the HTTPS protocol, the sequence diagram becomes a lot more complicated. In addition to TCP’s additional messages, the HTTPS protocol requires back-and-forth negotiation of the encryption ciphers, to ensure that both client and server agree on the acceptable level of encryption.
The following sequence diagram has been simplified, but still illustrates the amount of communication required to negotiate the secure connection.
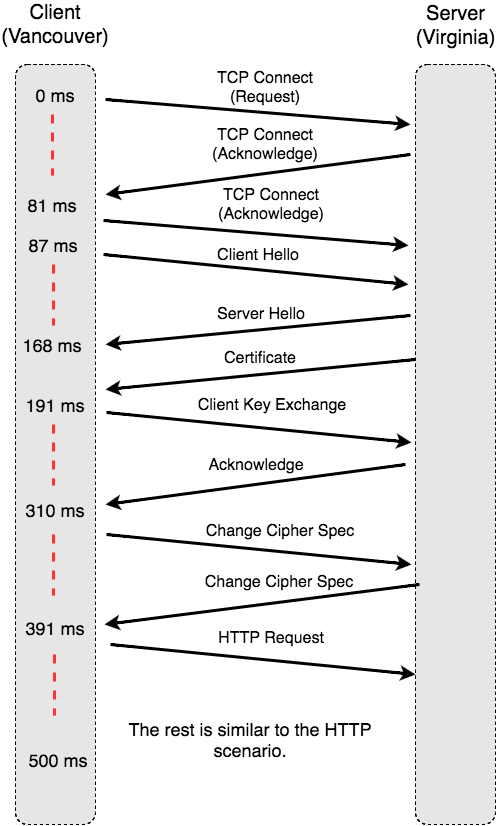
Even without understanding all the detail, it’s clear that the HTTPS protocol introduces a large amount of back-and-forth communication between the client and server, even before any data can be sent. Given a large network latency (between Vancouver and Virginia), we can now clearly see where the additional time is being spent.
Solutions
The additional time required to set up a secure HTTPS connection is quite significant, especially when connecting over large geographic distances. The question remains as to what we can do to solve this problem.
Solution 1: Don’t use Curl
Given our original intention of measuring the response time of a web application, it’s now clear that curl is not an appropriate tool, especially over large distances. A better solution is to trust the timing number in the application’s log files, or to run a packet sniffer (such as tcpdump) on the application server itself. The extra cost of network latency, and HTTPS protocol negotiation, adds too much uncertainty into the measurements.
Solution 2: Use Persistent Connections
Given that HTTPS connection negotiation is such a large factor in connection setup times, it pays to only do it once. Web browsers implement “persistent connections” as a means of reusing an HTTPS connection for multiple requests. That is, the first time they access a web server, they follow the full HTTPS connection process. However, for all follow-up requests to that same web server, they use the same TCP connection again, eliminating the setup time.
Additionally, browsers make multiple web requests in parallel, if multiple files are required from the same server (see https://sgdev-blog.blogspot.ca/2014/01/maximum-concurrent-connection-to-same.html). These requests each require N ms of network latency, but since all requests are done in parallel, the total time will still be N ms, rather than N x M ms, if M requests are required.
Solution 3: Connect to Near-by Servers
As we saw in our experiments, creating an HTTPS connection to a “close” server is significantly faster than connecting to a “far off” server, simply due to the the number of network round-trips required. Note that “close” is typically defined as being a geographic distance, but can also be impacted by the number of network “hops” between the sender and receiver (see https://en.wikipedia.org/wiki/Traceroute as a good way of measuring this).
As a result, creating an HTTPS connection to a nearby server, such as a Content Distribution Network (CDN) edge location, will enable much faster connection times.
Of course, there are plenty of other ways to measure response time, and to improve data transmission time, but that’s for another day…