
Ten Ways to Respond Interactively — Part One
How slow is too slow for a given activity? It depends on what you’re doing, how long you expect that activity to take, and how long it…


How slow is too slow for a given activity? It depends on what you’re doing, how long you expect that activity to take, and how long it actually takes. Throw into the mix, how important the outcome is to you, and how much you’ve paid for that outcome. In short, there are numerous things that impact whether something is perceived as being “slow”.
This blog post is about Interactive Response Time for web applications. That is, how long does it take for a web application to respond to a user after they’ve followed a hyperlink, or clicked on a button. Some operations are expected to take several seconds (such as uploading a file, or running a complex calculation), but in other cases, users may expect a much faster response. It’s not an exact science, but some have attempted to standardize what “satisfactory” actually means.
In the world of SaaS (Software as a Service), our ability to tolerate slowness is rapidly decreasing. We live in a world where mobile phones provide instant connectivity to friends, and search engines provide accurate results only milliseconds after pressing the Enter key. In some cases, we’re given predictive results before we even finish typing!
Providing good performance is an important part of keeping users happy. They often feel inconvenienced by a sluggish browsing experience, and may consider other products instead of yours. Even if you’re fortunate enough to provide a “one of a kind” solution, a competitor will never be far behind.
In this blog post, we’ll see a high-level framework for optimizing performance, aimed at readers who are fairly new to performance analysis. Without going into too much detail, we’ll discuss a number of areas where performance bottlenecks may arise. Given that each topic could be discussed in a blog post of its own, we’ll only be scratching the surface.
Throughout this blog post, I’ll briefly mention how we’ve chosen to address these concerns at my company, ACL Services, a SaaS provider in the Governance, Risk Management, and Compliance space. We make heavy use of Amazon Web Services, but regardless of your infrastructure provider, the solutions will be similar.
Data Flows
The following diagram illustrates the infrastructure of a typical web application.
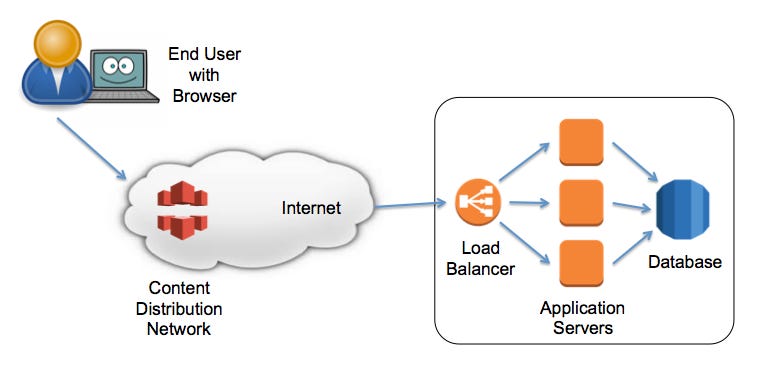
End User with Browser — The end user is clearly the person who judges whether interactive response time is acceptable. Their browser receives their mouse or button click, creates HTTP requests, transmits those requests to the web application server, then renders the HTML on the user’s display, executing JavaScript code when required.
CDNs (Content Distribution Network) — These are strategically-placed servers that are geographically closer to the user than the main servers hosting the SaaS application. CDNs provide increased performance for downloading “static” files. These include graphic images, HTML files (if they’re the same for all end users), CSS files, JavaScript code, and videos. That is, if there’s no need for the web application to customize these files on a per-user basis, the CDN can serve them more efficiently.
Internet — This is a sequence of routers, switches, and network pipes that connect everybody together. It includes everything from local connections to your house, through to high-capacity trans-continental links.
Load Balancer — The external-facing entry point for Internet traffic reaching your web application. The load balancer is responsible for distributing incoming HTTP requests across the pool of application servers.
Application Servers — The brains of the web application, responsible for interpreting HTTP requests, performing business logic, querying the database to retrieve persistent data, then rendering the appropriate HTML response page.
Database — Central storage for all of the web application’s persistent data.
Although there’s a lot of complexity not shown in the above diagram, a basic understanding of these main building blocks is enough for us to discuss interactive response time in more detail.
Areas for Improvement
Let’s now examine each of the major areas, to see how interactive response time can be improved.

Method 1 — Minimize Client-to-Server Latency
Anybody with a basic appreciation for physics understands that data takes time to travel across the Internet. Lights travels through a fibre-optic link at about 1000 km (600 miles) every 5 milliseconds (ms), which means that the round-trip time across a large country or continent is about 30–80 ms. Between continents, this becomes 100–200 ms. On top of this number, add congestion buffering delays of anywhere from 1 ms to 200 ms.
Therefore, always be aware of geographic distances between your customers and your servers. Encourage customers to use servers that are local to them, within the same country or continent. To make things even easier, consider using advanced replication and routing algorithms to make location choices automatic (without burdening customers with these issues). Because we use Amazon Web Services for much of our work, we can easily grow to new regions in the future, and can use geographic DNS features to minimize network latency.
In addition, consider moving as much of your content to Content Distribution Networks to push data as close as possible to end users. We use Amazon CloudFront to meet this need, extending our locality to 50+ edge locations, allowing customers to download files more efficiently.

Method 2 — Run Code in the Browser
With network latency in mind, a user’s interactive web experience will obviously improve if there’s no need for network interaction. With early web applications, every page transition (clicking on a link, or submitting a form) resulted in a fresh HTTP request between the browser and back-end server. With a round-trip delay of 50 ms, to several seconds, it was difficult to provide fast interactive response.
In modern web applications, we can often use browser-based programming languages (such as JavaScript) to interactively respond to users without HTTP delay. With the addition of features like HTML5 local storage, some of an application’s data can be stored inside the browser, rather than repeatedly exchanging network messages with the server.
When HTTP requests become unavoidable, it’s desirable to hide the requests in a background task, eliminating the annoying lag in response time. There are numerous front-end frameworks that make this straightforward to implement.

Method 3— Minimize Transmission Size
When network transmission is required, try to reduce the size of data being sent. This includes using compression to reduce file sizes by up to 90%, or using pre-compilation of HTML, JavaScript, or CSS files, to eliminate unnecessary white-space. We use a number of asset compilation techniques from the Ruby-on-Rails framework.
Although many of these ideas originated when wired networks were painfully slow (remember the sounds of a 300 baud modem?), they are still very relevant with today’s mobile networks. You’re probably familiar with having a poor quality 3G signal on your mobile device, where pages take “forever” to load. You’re also likely to see signal strengths vary as you walk through a large building, or enter an elevator. Downloading data as fast as possible is still very important.
Unfortunately, there may be a trade-off to make here, since time savings gained by making files smaller, could be offset by the CPU time required to compress and/or decompress them in the first place. Therefore, do as much pre-compilation of data as possible, leaving as little work as possible for each HTTP request.

Method 4— Reduce Round Trips — Prefetch
Given that network latency (typically from 10 ms to 200 ms) is one of the largest contributors to interactive lag, it pays to get as much done in as few HTTP requests as possible, or do as much as possible concurrently.
Imagine a worst-case scenario where a single web page generates 100 additional HTTP requests to load embedded images. If requests were performed sequentially, the entire page would take anywhere from 1 second (10 ms / request) to 20 seconds (200 ms / request). It clearly pays to reduce the number of HTTP “round trips” when loading a web page. Browser manufacturers understand this reality, and submit HTTP requests in parallel, whenever possible.
One approach to reducing round trip time is to prefetch data into the browser, but only show it to the user when requested. This allows whole sections of information to be revealed, or hidden, based on the user clicking on specific links, buttons, or tabs. The user will experience excellent response time, but is blissfully unaware that all the required HTTP requests have already taken place.
Another approach is to use the async feature in HTML5, which helps speed up the rendering of web pages. By allowing JavaScript to execute in parallel with other page-loading activities, rather than causing them to block until the script completes, the overall response time is improved.
In a similar way, parts of a web page can be lazy loaded when they’re actually required. That is, until the user scrolls down to view the lower part of a web page, there’s no point in loading all the page content. If the user never scrolls to the bottom of the page, the relevant HTTP requests can be completely eliminated.

Method 5 — Faster Servers
Often the easiest approach to fixing performance problems, especially in a cloud-centric environment, is to simply “beef up” the RAM or CPU of the servers running the web application. The faster your CPU, the faster the application runs. The more RAM available on the servers, the less dependency your application has on secondary swap space, and less time is spent garbage collecting to reclaim unused memory.
The obvious downside of increasing server size is the increased cost. In a cloud-based environment, it’s trivial to provision a larger server, although you might not think about the cost until the end of the billing cycle. We use Amazon EC2, which not only provides flexible pricing (different instance sizes, reserved instances, and spot instances), but also provides an extensive range of tools and features for analyzing and reducing cost.
The less obvious downside is that using faster servers is a “band-aid” solution. If you have performance problems somewhere else in your system, then increasing server size simply masks those problems for a while. That is, unless the real problem grows out of control again.

Next Time…
So far we’ve seen five different areas of optimization for improving interactive response time. In the next blog post, we’ll examine five more approaches, and will discuss the importance of measuring performance using realistic and scalable data sets.