
Ten Ways to Respond Interactively — Part Two
In my previous blog post, I introduced the concept of Interactive Response Time, as a measure of a web application’s responsiveness to a…


In my previous blog post, I introduced the concept of Interactive Response Time, as a measure of a web application’s responsiveness to a user’s mouse clicks. I then showed the high-level architecture of a typical web application (in our case, using Amazon Web Services), and provided my first five (out of ten) recommendations on how to improve response time.
In this post, I’ll continue with the remaining recommendations, and will then cover two more topics:
The importance of measuring interactive response time using realistic data sets and server infrastructure.
How a software development organization can adopt a mindset of responsiveness.
First, let’s continue with methods 6–10 for improving interactive response time in a web application. This discussion is aimed at developers who are fairly new to the idea of performance analysis. Although we briefly discuss some of the solutions, we’ll defer to future blog posts to provide more detail.
Method 6 — Replicate Data Paths
As shown in our architecture diagram from Part 1, we typically have multiple application servers supporting our web application. In addition to providing fault tolerance (if one of them fails), multiple servers can handle a higher number of concurrent HTTP requests. In theory, if each application server completes its work independently from others, adding more servers provides a near-linear increase in scalability, at least to a point.
When considering interactive response time, having more application servers means that each of them has less work to do, and will therefore be able to service HTTP requests more efficiently. Clearly, 5 servers handling 20 requests each will provide a better response time than a single server juggling 100 concurrent requests.
At some point though, adding more servers becomes a problem, specifically when other parts of the system become congested. For example, HTTP requests must still pass through the single Load Balancer, which can no longer provide fast response times. Additionally, the backend database service is a central repository for all persistent data, and as we’ll see later, is a frequent source of performance issues.
At ACL, we take advantage of AWS’s Elastic Load Balancer (ELB) and Relational Database Service (RDS) that have built-in support for replication. So far we’ve had great success with the level of scalability and performance they provide, although in future we might consider adding custom layers of replication to further improve response time.

Method 7 — Use High-Performance Languages and Frameworks
Once an HTTP request reaches an application server, there are numerous CPU-intensive tasks to be performed, and they’re performed every time an HTTP request is received, or a response is sent. The faster these tasks are completed, the lower the interactive response time.
For example, an incoming request, or outgoing response, passes through the following phases (in no particular order):
SSL termination (if not already done by the load balancer).
Compression/Decompression of data.
Parsing or generation of the HTTP message, including headers.
Authentication and Authorization.
Creation and clean-up of in-memory objects (such as controller objects, or database records).
Reading of files from the disk.
Rendering of HTML, CSS, and JavaScript pages.
And for complex web applications, the list is much longer.
To reduce interactive response time, using a high-performance programming language is one possibility to consider. Using compiled-to-native languages (such as Go or Java, or even C/C++) gets these tasks done in significantly less time than with interpreted languages (such as Ruby or Perl).
However, this approach comes with a serious trade-off of performance versus time-to-market, since compiled languages can drastically increase the time required to deliver new product features. The best practice is to analyze your overall system performance, and then only optimize the portions of code that are problematic. Start by identifying the ~5% of your code that is “slow”, and then consider rewriting it.
You may question why it’s important to optimize the time spent in the application server. After all, the end-to-end response time is often dominated by network latency, or by the database (as we’ll see later). Let’s not forget though, an application server handles multiple HTTP requests from multiple end users. If the application server code were to be five times faster (such as 10 ms instead of 50 ms), then five times the number of concurrent requests could be handled by the same server, without the need to queue-up requests. From a cost-saving perspective, this is important!

Method 8 — Optimize Code Paths
Regardless of which programming language is used, the application code can be optimized by thinking carefully about the algorithms and data structures used to process HTTP requests. If possible, use optimized algorithms that compute the same result in less time, or use heuristics that are almost as good, but significantly more efficient. Likewise, use memory-efficient data structures, rather than being greedy about allocating objects (which only serves to keep your garbage collector busy).
There are numerous profiling tools to help with code optimization. These tools trace your code’s execution path, highlighting where the CPU spends most of its time, or where the different types of memory object are allocated. By quickly identifying the hot-spots in your code, and spending time fixing those problems, significant performance gains can be achieved.
Another benefit of these profiling tools is that they don’t highlight code paths that are not executed frequently, and therefore don’t need to be optimized. On the other hand, if you were to visually scan your code and “guess” which algorithms might be causing problems, you could be completely wrong. The best practice is to only optimize code that actually needs to be optimized.
Optimization of code can be tricky though, and often results in trade-offs being made. You may choose a simplistic algorithm, allowing you to deliver new features on a tight schedule. Likewise, you may choose a memory-greedy solution to reduce your dependency on the external database. A balance is needed to ensure that all your resources (including response time) are weighed appropriately. With complex systems, it’s not an easy problem to solve.

Method 9 — Optimize Database Queries
A database is a central repository for persistent data. Most HTTP requests result in a corresponding query being sent to the database, making it a potential bottleneck for response time. This is especially true when many application servers are competing for the single shared resource.
Experience shows that queries can range from less than 10 ms, to greater than 10 seconds, depending on complexity. There are numerous books published on how to optimize queries, but here are some simple hints to consider:
Load only what you need — Be careful to only select the data that you really need. In SQL databases, this implies careful use of “select” and “where” clauses to only retrieve the columns and/or rows you really care about. If possible, consider pagination as a means of loading only the data needed to display the current page of results, rather than loading everything at once.
Use in-memory caching — If possible, consider caching database results in your application server’s main memory, or perhaps on a high-performance cache server. Rather than executing a complex query multiple times, save the result of the query the first time it’s executed, then use a cached response for successive queries. We use Amazon ElastiCache for exactly this purpose.
Use table indicies — When retrieving data from a table by specifying a search key, consider adding an index to that table. This includes additional meta information in the database, allowing records to be found significantly faster than without an index. Unfortunately, use of an index is not free, as it requires extra storage, and must be kept up-to-date. Only add them if there’s really a performance problem to fix.
Reduce the number of queries — A common problem, especially with object-relational mappings, is to create “N+1” queries. That is, the first query retrieves N rows from the database, which then triggers an additional query for each row (a total of N+1 queries) to fetch related information from other tables. To improve performance, identify these problems and eager-load related tables as part of the first query, rather than issuing multiple queries to the database. Of course, be careful not to eager-load too much information, otherwise that single query will take forever!
Study “Query Execution Plans” — Advanced database systems can explain how they’ll go about executing your query. By spending time to understand these query execution plans, you have the potential to reduce the response time for each query, and therefore the overall interactive response time of the system.
Next, let’s think about the database server itself.

Method 10 — Tune Database Servers
In addition to optimizing database queries, the database servers themselves can benefit from tuning. All modern database systems (such as Postgres or Oracle) provide analysis tools to show how many disk reads and writes the server is performing, as well as how much buffer space is currently in use. If these metrics go beyond acceptable limits, performance of the whole web application suffers.
Tuning a database server is complex, but often involves pre-allocating buffer space so that operations complete quickly, due to the reduced interaction with external disks. This means that the underlying servers must have plenty of RAM installed. Experience shows that running low on memory is a guaranteed way to “hang” your web application, sometimes causing a 100 ms request to take > 10 seconds!
When disk interaction is required, it’s critical to use high-performance SSDs (Solid-State Drives) with plenty of caching enabled. Gone are the days where it’s acceptable to wait for a rotating disk (“spinning rust”) to fetch data. With a high volume of HTTP requests, any significant amount of queuing will kill your interactive response time.
For highly-scalable web applications, it’s important to have multiple database servers, rather than just one. Not only does this improve fault tolerance (if one fails), but the query load can be evenly distributed. The technique known as “sharding” can distribute data across multiple servers, with a consistent key-hashing algorithm used to predictably decide where each data record resides. For example, users from ‘A’ to ‘F’ on one server, ‘G’ to ‘M’ on the next server, and so on.
Needless to say, a lot of effort can be put in tuning database performance! We use Postgres (provided by Amazon’s Relational Database Service), and are impressed by our ability to view and tune the server’s performance.

This brings us to the end of the ten recommendations for improving interactive response time. Let’s now consider how response time is impacted by large amounts of data.
Performance at Scale
As software developers, we often fall into the trap of testing our code using small data sets, running on desktop or laptop computers. It’s rare for developers to have full access to production-sized servers and networks. As a result, any improvement we make with interactive response time is typically focused on a small number of web requests, using a small amount of data.
As an example, a software developer could measure the following performance numbers on their desktop PC, within their company network.
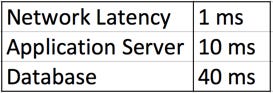
With these results, the most obvious place for improvement is the database, which dominates 80% of the request time. However, how do these numbers vary when realistic customer-sized data is used? Here’s an example:
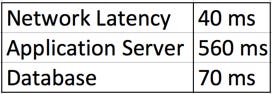
The network latency has increased, since the customer is further away from the SaaS application. However, why is the application now spending most of its time in the application servers?
There are several possible reasons for this, including:
The customer’s data is more complex than the developer’s test data, and the complexity of the internal algorithms is exploding. Even though it doesn’t take long to fetch data from the database, the time to process that data has become significant.
A simple operation that was deemed as “fast” in a small-scale environment is no longer fast. For example, if part of the algorithm takes 1 ms to execute for each database record, then dealing with 500 database records now takes 500 ms.
Multiple customers might be sending requests at the same time. Therefore, for most of that 560 ms, the customer’s request is sitting idle in queues, waiting to be serviced.
How can these problems be resolved? There are many approaches to consider, including:
Review the architecture of your application. Consider the overall flow of data through your system, and determine ways to reduce the number of components involved. As an example, if data can be cached in memory (using something like Redis), you can eliminate expensive calls to your external database (such as Postgres).
Add new worker threads/processes to your application. This often requires adding more CPU or RAM to your servers, which clearly costs money.
Improve your code by optimizing algorithms, and eliminating unnecessary memory allocation. This allows requests to complete faster, and therefore a higher number of concurrent requests can be serviced.
Consider implementing core pieces of your application in a faster programming language. This requires development time (which costs money), but could significantly improve your interactive response time, when placed under load.
The moral of the story is to always test your interactive performance using life-sized data. Have at least one scalability test environment available for developers to test their code. Also, ensure that developers have a means of testing with real customer data, or something that’s equivalent in size and complexity.

Making it Happen
Even if you’re a true believer in optimizing response times, you may encounter business realities that get in the way. Here are some ideas on how your software organization can adopt a performance-centric mindset:
Define what “good enough” means to your organization. Is it acceptable for 95% of your web requests to be serviced within 500 ms, or do you have stricter requirements that 99% must be faster than 200 ms? Perhaps your product is in the early adoption phase, where 1–2 seconds per request is quite acceptable. Without a company-wide agreement on the standards, you’ll have a hard time convincing people there’s a problem to fix.
Make sure you have tools available for developers to measure and improve performance. For example, provide daily reports on whether you’re meeting your targets. If that doesn’t work, consider “breaking the build”, making it impossible for developers to ignore the issue. Also, ensure that developers have access to realistic data sets, and the ability to test in production-sized environments.
Ensure that all levels of management are on board with the plan. There’s always a tricky balancing act to ensure that new product features are released on a timely basis, that bugs are fixed when appropriate, and of course, that interactive response times are maintained at a healthy level.
Nominate champions within the QA and Software Engineering groups. Even with regular management pressure, it still helps to have champions working at grass roots level to identify and help resolve issues. These people may not fix the problems themselves, but will nudge their peers to focus on the problems, while providing advice on how to correctly implement the solutions.
Summary
Interactive response time is an important part of keeping a SaaS application running smoothly, providing a pleasant experience for end users. There are numerous places in the SaaS product where performance bottlenecks can be introduced, with various ways to resolve them. It’s critical to measure performance using production-like infrastructure and customer-sized data sets. Finally, having a company-wide appreciation of performance is an important part of maintaining the levels of response time.